My apologies for a long post but it’s a complex subject – please stick with it but I have split it into Parts 1 and 2,
Right up front I need to declare my strong interest in this subject. I was a Board Advisor and a shareholder of a company called Actual Experience who monitored the Quality of Experience of the Falkland Islands’ broadband services from 2010 to 2015 and many Falkland Islanders will know me from that activity. I was also an advisor to another company who benchmarks mobile data in real time. There is only one other company who independently undertakes this activity in the world. I have had over 10 years of experience in this space and am passionate about Quality of Experience of ISP broadband services and enterprise networks.
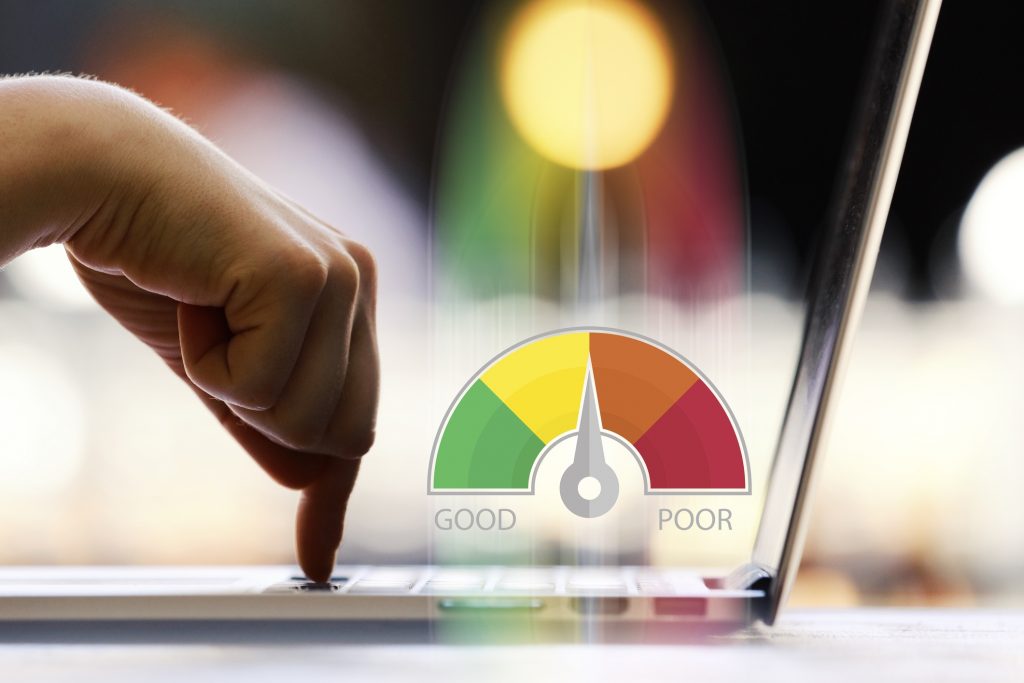
The measurement of download and upload speed of any Internet connection is a complex and confusing activity. Falkland Islanders know this better than most because it varies so much during the day. Actual download speeds rarely match the headline speeds that determine how much you pay – Bronze, Silver and Gold.
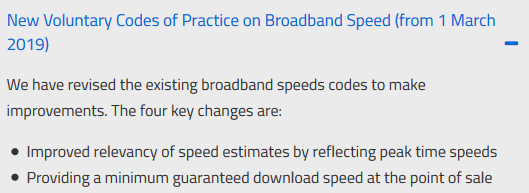
OFCOM’s March 1st 2019 new ISP Code of Practice .
Even in the UK reporting download speed is critical issue that has required strong intervention from the UK’s telecommunications regulator, OFCOM. After March 1st 2019, UK ISPs must stop using the exceedingly misleading term of ‘up to’ in their advertising through adopting a new voluntary Broadband Code of Practice. Most UK ISPs have followed the guidelines after OFCOM gave them twelve months to get their act together.
This ‘up to’ language implies the maximum speed your broadband connection will run at, but in reality it will run at much slower speeds at certain times of the day due to congestion and high Contention Ratios – even in the UK where we do not have the bottleneck of a 210Mbit/s satellite link. I’ll talk more about Contention Ratios in a future post.
The crucial bit is that ISPs should not use misleading maximum download speeds but give consumers realistic minimum speeds at peak times. OFCOM’s demands can be seen below
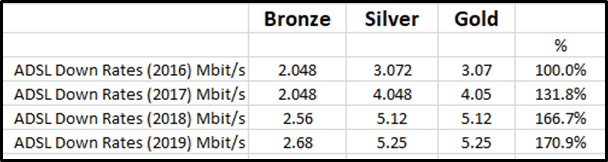
Falkland Islands’ maximum broadband download speeds.
A similar situation occurs in the Falkland Islands. The maximum download speeds for each broadband package has been increased in recent years as one of the Key Performance Indicators (KPIs) specified in Sure’s licence. These are maximum rates like the ‘up to’ rates that used to given in the UK and will rarely be hit other than for local IP traffic that does leave the Falkland Islands via the satellite.
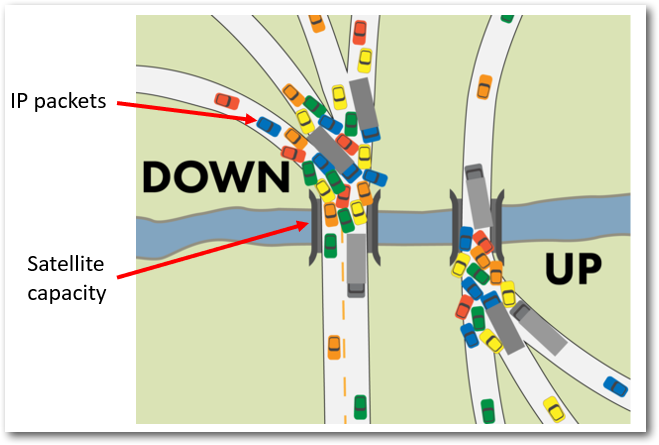
Clearly, with over 1900 households in the Falkland Islands and with the vast majority paying for a broadband service, if everyone tried download a big file or video at the same time then this high level of demand would certainly exceed the capacity of satellite which in 2018 is 210Mbit/s. In these circumstances, the local ISP would need to start automatically ‘Traffic Shaping’ as described in my earlier post – The enigma of the monthly Internet usage quota. Look at this post for more information on the need for usage quotas and traffic shaping to manage excessive demand.
If they didn’t, the broadband service would certainly grind to a halt. It’s a simple calculation really; if 300 Gold customers simultaneously tried to download a large file, the this would require 1500Mbit/s satellite capacity! This would not generally happen in practice due to the statistical probability that not everyone would trying to download at exactly the same time, as well as the intense self-control exerted by users to avoid hitting their monthly quota
It would represent a significant step forward if the local ISP was ‘requested’ to start, on a voluntary basis, publishing either average or minimum download speeds in line with best practice in Europe. Of course, this would not change the performance of the broadband service one iota, but it would prevent misleading and potentially irrelevant rates being quoted to new customers or when upgrading.
The really key challenge here is how are those average or minimum speeds to measured? Therein lies the dilemma.
Measuring the Quality of Experience or Quality of Service of the Falkland Islands’ broadband service.

So what is the state of play of independent broadband services monitoring of the Falkland Islands broadband service?
The current round of activities were triggered by the following recommendation of David C. Brown, ex-Attorney General in the public ‘Regulator Report – Sure South Atlantic Limited satellite upgrade’ on15 September 2017:
“The Regulator is considering a passive monitoring of some Sure information to assist in assessing the consumer experience. This may give reassurance to Sure and the consumer that an objective benchmark is available. The measurement of variations in service such as the slowing down of service during periods of high network utilisation must be clear. This has a significant impact on consumer satisfaction and clarity on the level of service both against the KPI and normal operation must be properly considered.”
This was a key recommendation which, I hope, derived directly from my discussions with the ex-Attorney General in the summer of 2017.
In the Falkland Islands Communications Regulator’s 2018 report, the state of broadband monitoring was discussed and a number of issues outlined.
“Independent monitoring of Quality of Service Passive monitoring, through an independent third party, of broadband services may assist in assessing the consumer experience. Throughout 2018 the Regulator has been investigating the viability of passive monitoring in the Falkland Islands.”
Outside the Falkland Islands, truly independent monitoring of broadband services is accepted to be mandatory these days so the “may assist” language is little bit of an understatement. In fact, it is quite well known that the Falklands Islands Government already has world-leading experience of doing just this from 2010 to 2015 through using a company called Actual Experience.
But, this seems to have been forgotten in the change of regimes on the Falkland Islands. This is certainly a missed opportunity.
The 2010 to 2015 broadband monitoring by Actual Experience.

FIG’s Actual Experience Quality of Experience broadband was kicked of by David Pickup the then Attorney General supported by several MLAs in 2010.
The key tenet of Actual Experience is “Users judge their service provider solely by their SUBJECTIVE experience of applications” and this is what Actual Experience measures in real time. Every minute of every day. There were certainly limitations in what Actual Experience could measure due the nature of the Falkland Islands broadband service. I will explain why a little later but that limitation is still an issue today.
I won’t go into too much detail about how all this was done in this post, but here are a few examples of what FIG could see in real time.
Example 1. ISP planned outage.
The ISP sent out a what is known as a ‘Planned Outage’ report to its broadband customers on the 21st July 2014:
“Dear Customer, Due to essential work required to upgrade part of our Satellite Communications equipment, there will be unavoidable disruption to off-island services from 00:01 on the morning of Wednesday 30th July 2014, lasting approximately 4 hours. All international services will be affected; internet, leased circuits, voice & fax services. We sincerely apologise for any inconvenience this may cause.”
FIG and other stakeholders could actually see the planned outage in real time and observe that it lasted only one hour rather than the four hours predicted.
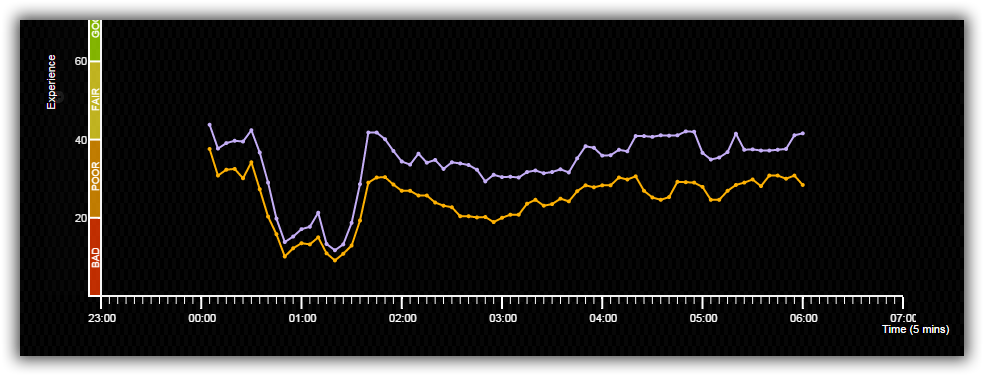
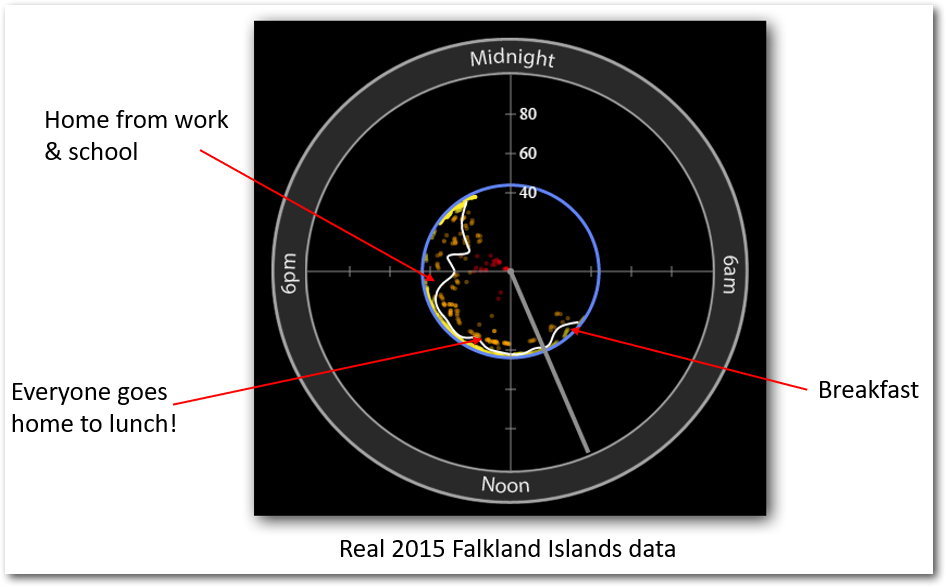
Example 2. Time of day congestion.
The Falkland Islands’ broadband service slows down at certain times of the day as shown on the clock face presentation in the picture below. Red dots show poor service and amber dots good service. This not because the global Internet is getting clogged; it is because the satellite link is unable to cope with the level of demand and the ISP is traffic shaping to ensure a ‘Fair Usage’ policy to make sure everyone still has some level of service.
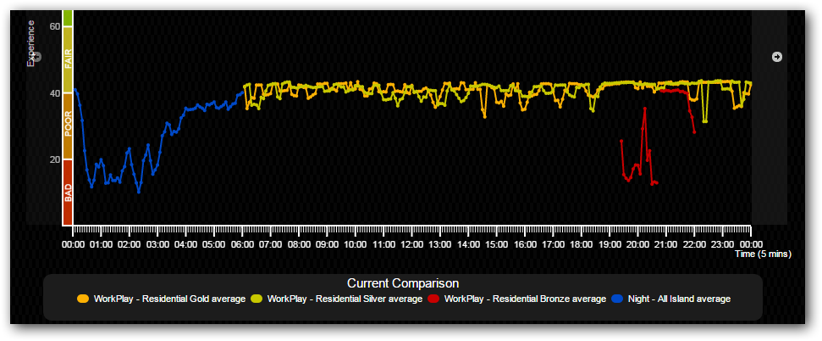
Example 3: Comparing broadband services.
Shown below is a graph comparing bronze, silver and gold broadband services on the 30th April 2015. Notice the difference between the free night time service and the day time service? There were a few hiccoughs on the Bronze service at 19:30.
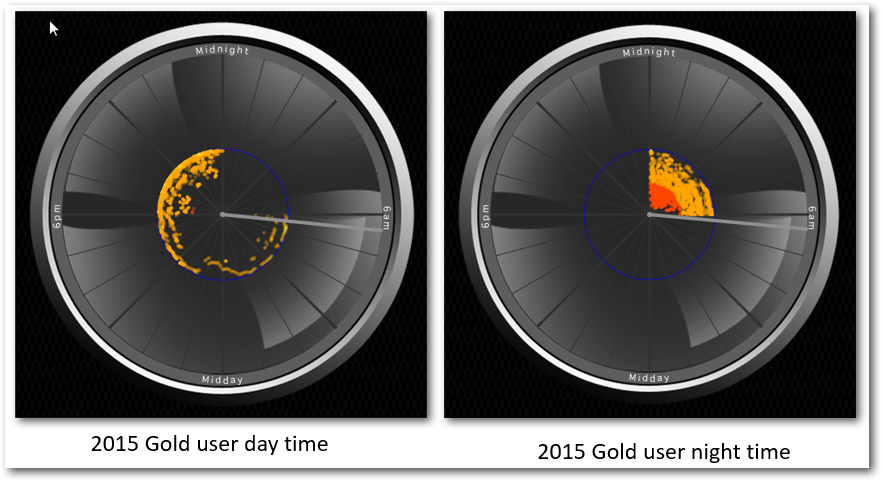
Example 4: Comparing day time and night times.
This picture below compares day time and night time Quality of Experience of the Gold service. Amber is good and red is bad.
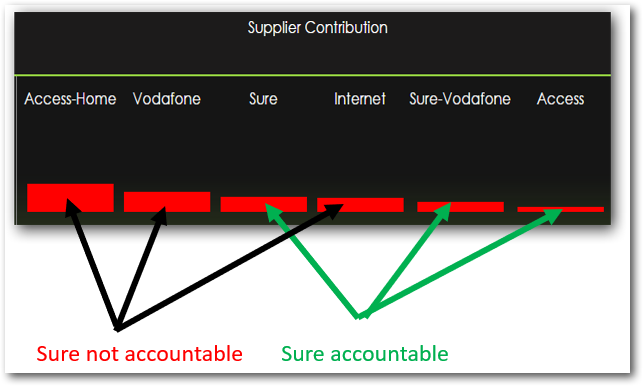
Example 5: Allocating the source of the impairment.
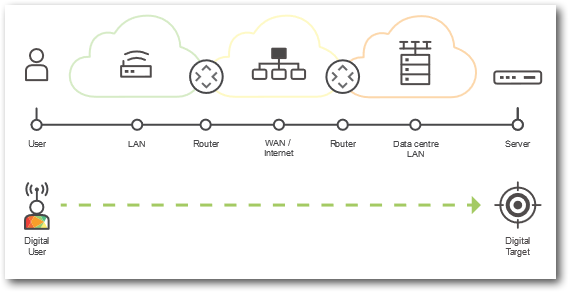
Most importantly, Actual Experience could be determine exactly where any impairment that occurred on the link from a user’s PC to the web service server. The ISP is only responsible for the network that they manage and not for other networks up-stream from the satellite. They were also not responsible for WI-FI performance.
from June 2014 to May 2015.
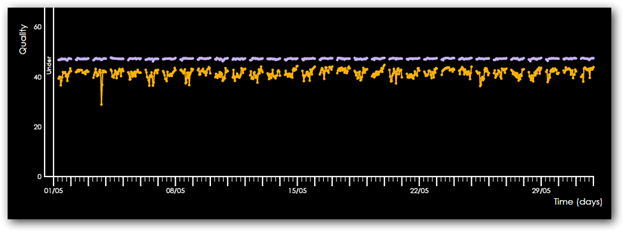
Example 6: Monitoring graphs should be boring.
Lastly, the picture shown below is what a broadband service should look like as it did on one day in May 2015 – a straight line – all very boring but it does not detract from the importance of seeing this. Actual Experience’s software alarmed when service deteriorated.
What is measured to determine Quality of Experience?
- Packet delay: ‘Ping’ measures the round-time trip delay for messages sent from one router to another. When there is congestion, delays increase.
- Packet Jitter: ‘Jitter’ occurs there is congestion, jitter, where each packet arrived at a slightly different time) increases significantly.
- Download & upload speed: Actual Experience did not measure download speed as doing so would consume a significant amount of data!
Why measuring download speeds throughout a 24-hour period in the Falkland Islands is more than challenging.
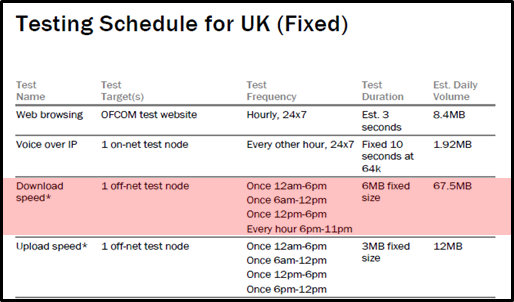
Why should this be? For example, SamKnows (a competitor to Actual Experience) used the above tests in the UK when it worked with OFCOM in 2017.
Running 24 tests for one month = 67.5MB x 24 x 31 = 50GB of downloads!
Any solution going forward based on measuring download speeds would need to be resolved, which I believe can be done.
The need for truly ISP independent monitoring.
In the Falkland Islands Communications Regulator’s 2018 report, it was stated:
“…Primary issues of such systems are the cost to the Regulator but also to the consumer. Any device connected to a consumers internet service has the potential to use data and therefore needs agreement with the ISP to return this data to the end user, thus removing the independence of any monitoring as the ISP would have to partner with the Regulator on such an initiative”.
I would have to disagree with this statement. In the case of the Actual Experience programme, thirty to forty ‘volunteers’ were found in the Falkland Islands in Stanley and Camp who were willing to host Actual Experience’s software through the help of a local organisation. A small amount of data was consumed with the testing (significantly less than needed in measuring download speeds) and FIG financially compensated these users for using some of the Volunteers’ data quota.
Sure was never told of who the actual volunteers were but it would not take much effort on their behalf to find out through analysis of IP traffic. Of course, assurance would need to be obtained that the monitoring traffic was not subjected to ‘preferred prioritisation’ to improve the score of those particular customers.
In other words, the Actual Experience monitoring was truly independent of the ISP which is how monitoring must work if the results are to be trusted. I believe the programme was judged to be a success and certainly helped identify some network issues when ‘events’ were detected. At this point a dialogue was undertaken with the ISP to identify the exact cause of the issue and what was going to done to correct it and prevent it ever reoccurring.
Sadly, the Actual Experience programme was dropped in 2015 due to lack of FIG budget.
In the Falkland Islands Communications Regulator’s 2018 report, it was stated:
“There are a number of issues that have presented themselves which require further investigation in 2019. The primary issue being that international providers of services such as this have no incentive to prioritise contracts with such a small market as the Falkland Islands. The Regulator has made a number of attempts to get quotes for such services but has yet to be provided with any detailed costings.”
It will be interesting to see if the attempts by the Regulator for the provision of these services bear fruit, and the Falkland Islands can once again have an independent monitoring of the broadband system in place.
In Part 2 of this post will look at a possible way forward.
Chris Gare, March 2019 Copyright: OpenFalklands